Gnuplot
FILES:
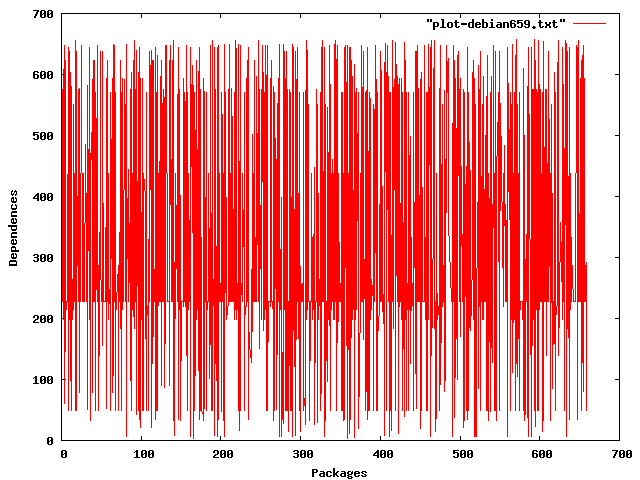
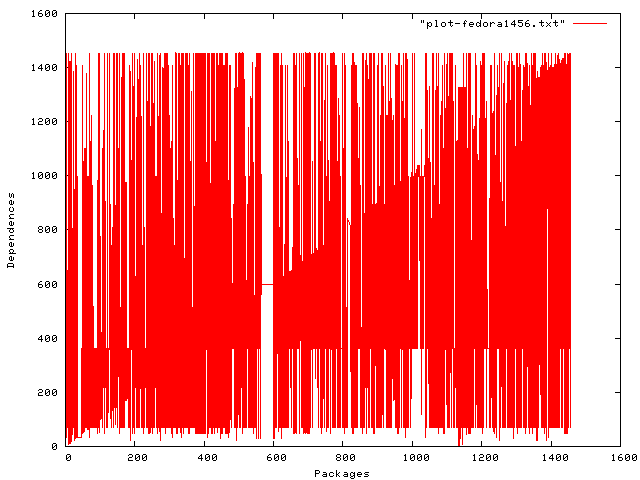
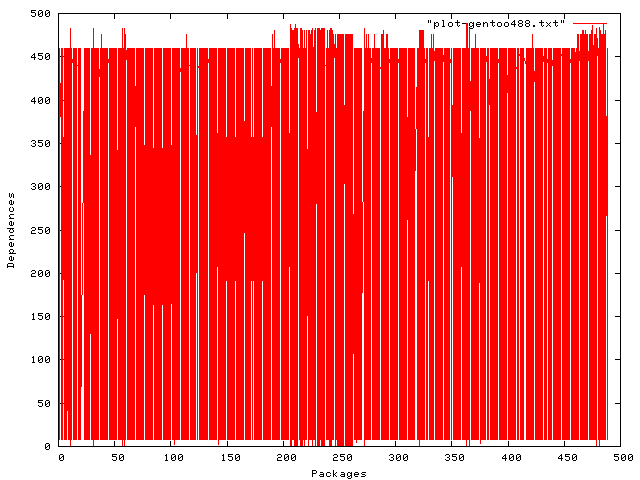
Graph: Debian, Fedora, Gentoo
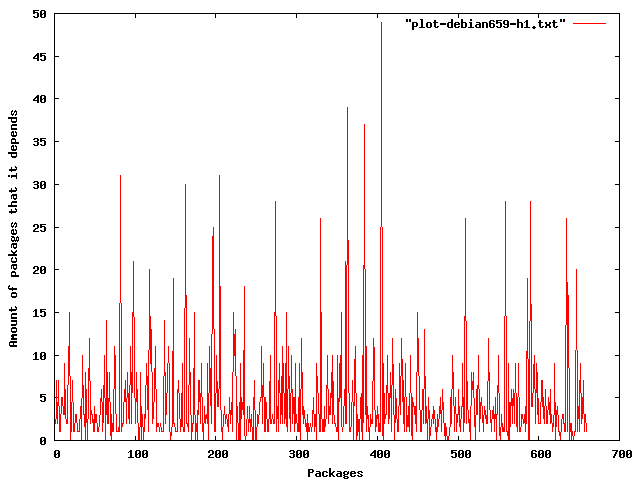
Histogram 1: Debian, Fedora, Gentoo
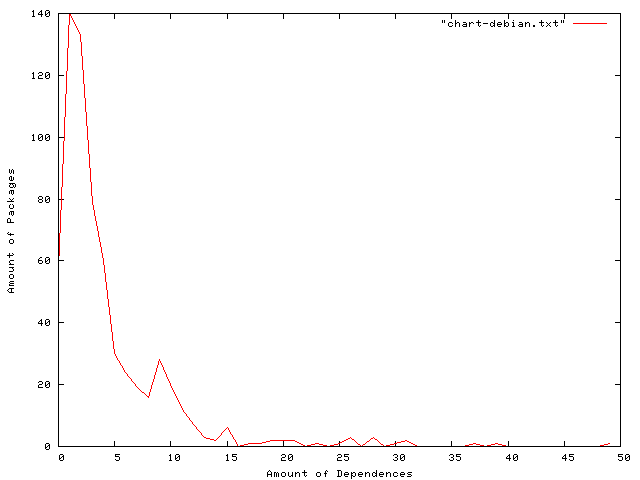
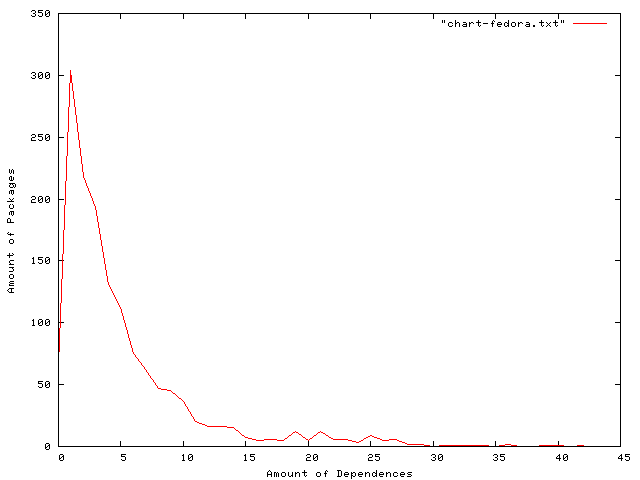
Histogram 2: Debian, Fedora, Gentoo
Histogram 3: Debian, Fedora, Gentoo
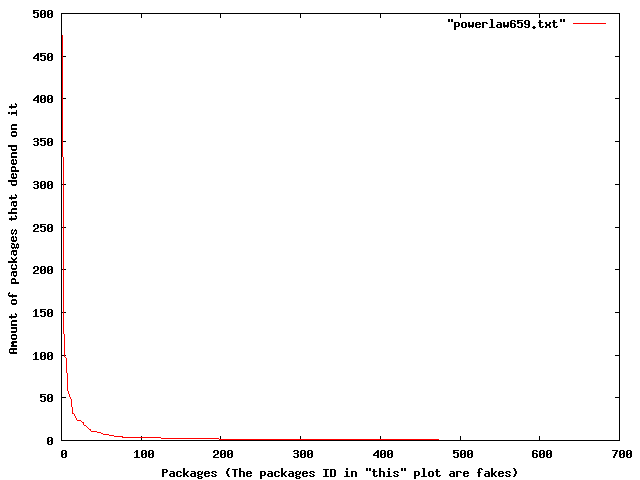
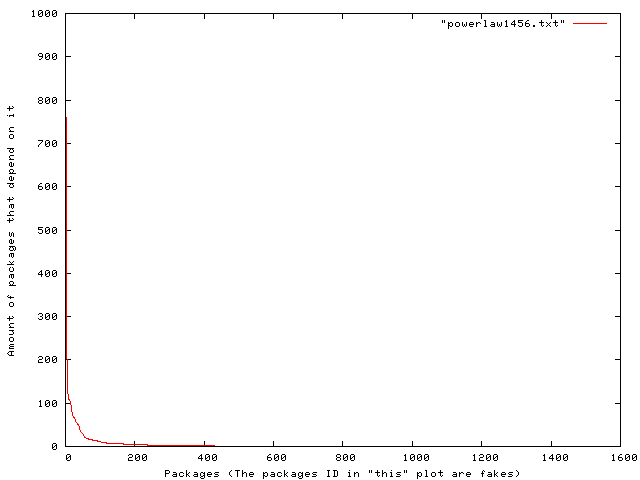
(*)POWER LAW: Debian, Fedora
PLOTS:
Graph: Debian, Fedora, Gentoo
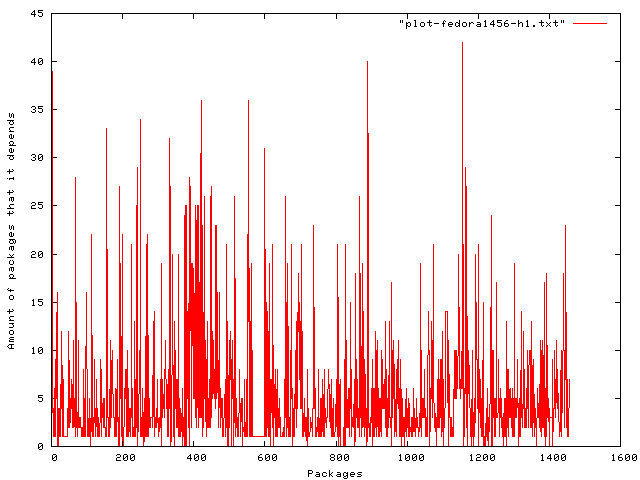
Histogram 1: Debian, Fedora, Gentoo
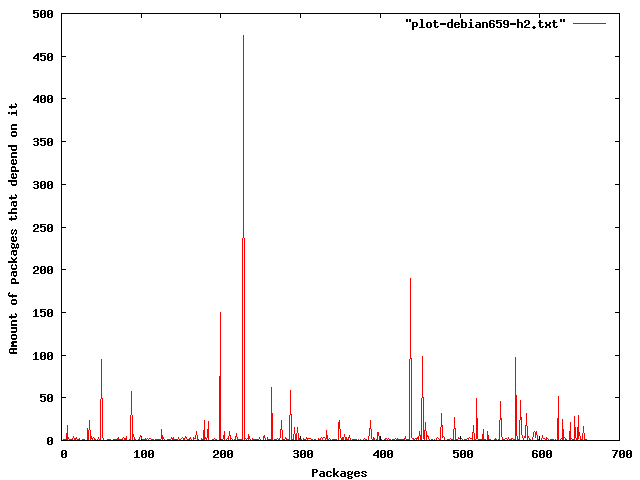
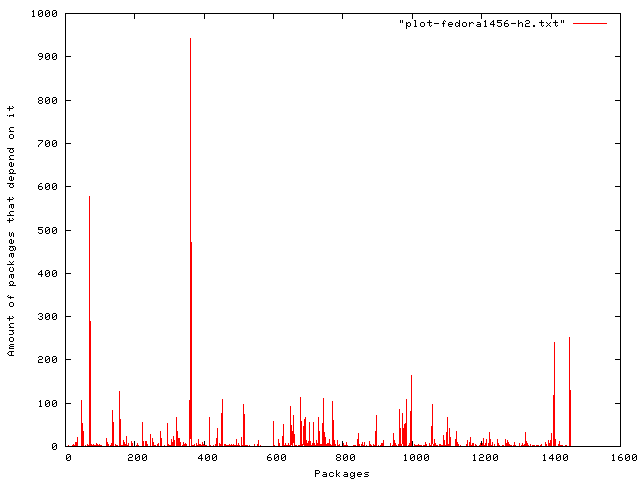
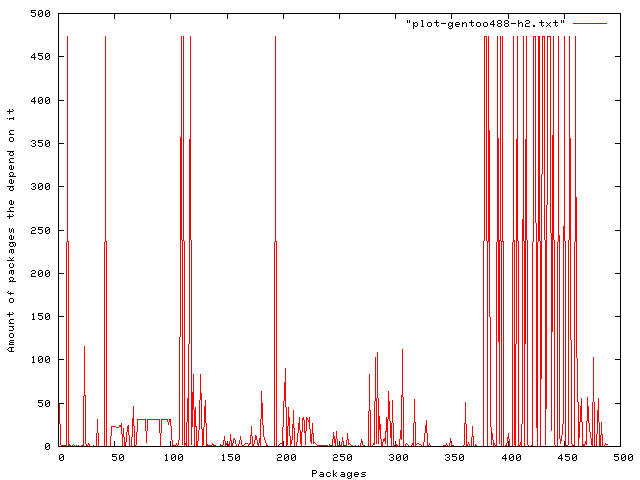
Histogram 2: Debian, Fedora, Gentoo
Histogram 3: Debian, Fedora, Gentoo
(*)POWER LAW: Debian, Fedora
(*) This PLOT is the histogram 2 (sorted) to power law visualization. I have changed the packages ID to follow the order of the dependences. So, the package that have the greater dependence number (ID=228 libc6) with 474 packages that depend on it, becomes 1 and so on…
