Fake…
That was a simple but nice one… i did see a huge write performance on one of our storages.
Take a look at this slog device (SSD):
r/s    w/s   kr/s   kw/s wait actv wsvc_t asvc_t  %w  %b device
0.0 10494.5    0.0 55834.4  0.1  2.5    0.0    0.2   8  90 c7t1d0
At first look was “Wow“, that’s cool! But, cannot be “true”… well, at least doing something really useful. To confirm that, i did look at the network interface to see what was the bandwidth used for that storage (with such write load, the traffic should be high). But like the iostat was showing, something like 40MB/s average.
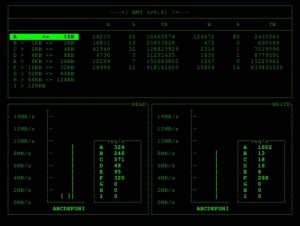
So, i did use a little tool i did write for use Dtrace and see the NFS recordsize distribution in a simple “ncurses” way, and bingo!
Here you can see the picture:
As you can see in that screenshot, we were having something like +80% of write requests with size like “Bytes”. Ok, that an SSD can handle like “K’s” of requests…
Because of a weird behaviour with Dtrace and NFS protocol (Bryan did explain it), i was not able to see every file but could pick some to understand what was going on. It was a migration procedure that was referencing “dead links” as fast as possible and creating temporary files for this on the NFS share.
At the end, was nice to see ZFS Hybrid Storage Pool architecture handling such (unuseful) load!
peace


